Dashboard
The MIP Cloud Dashboard gives you a detailed summary of your organization's financial state for the current fiscal year. When you start MIP Cloud or when you select Dashboard on the Main Menu from any other part of the application, your dashboard is automatically loaded into the task window.
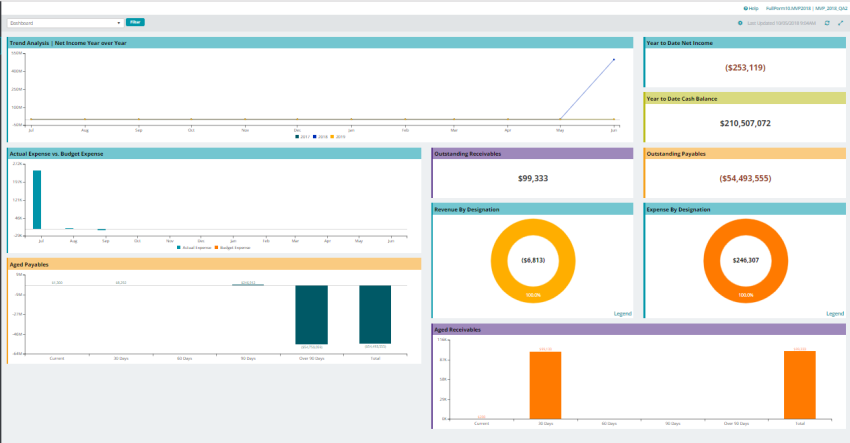
The system default view of the dashboard includes four Key Performance Indicators (KPIs) and three chart types (Bar graph, line charts and donut charts). MIP Cloud allows you to interact with your data. The charts and KPIs allow you to drill down to GL Codes and further down to the document list level.
Use the Dashboard drop-down list to filter the System Dashboard view by:
- Dashboard (Default)
- Accounts Payable
- Accounts Receivable
- Budget Monitoring
- Cash Management
- Executive View
- Financial Performance
Click the Filter button located next to the Dashboard drop-down list to filter the dashboard results displayed by:
- Chart of Account Segment filtered by Single Segment Code and Selected Code
- Chart of Account Segment filtered by Report Group and Report Group Set\Report Group
The Gear icon and Refresh icon appear on the top right corner of the screen.
- Click the Gear icon to display Dashboard Options Form and create a custom dashboard with moveable dashboard widgets.
- Click Refresh to replenish your dashboard with the most recent data. The time stamp next to the refresh button displays the last updated date and time.
All charts and KPIs values are defined by the user log in date.
Charts
The system default set of charts shows role-related data such as comparative totals over time and/or a breakdown of revenue or expenses by designated categories. Click on the charts to drill down further into the features and to the specific GL code documents. The fiscal year is determined by your organization's fiscal year date.
Note: The system default set of charts cannot be move. Click the Gear icon to display Dashboard Options Form and create a custom dashboard with moveable dashboard widgets.
The following charts are available for display on the dashboard:
- Trend Analysis | Net Income Year over Year: A line chart comparing the net income for the previous two fiscal years against the net income for the current fiscal year to date.
- Actual Expense vs. Budget Expense: A chart comparing actual expenses to budgeted expenses for the current fiscal year to date. The chart includes two bars per month. The first bar indicates actual expense amounts while the second bar indicates budgeted expenses. Hovering over a bar to display a pop-up with the month and the exact amount details.
- Revenue By Designation: A donut chart showing the organization's revenue for the year to date, broken down by designation. Only designations for which at least one transaction has been entered are displayed.
- Expense By Designation: A donut chart showing the organization's expense for the year to date, broken down by designation. Only designations for which at least one transaction has been entered are displayed.
- Aged Payables: A chart displaying the amount currently owed to creditors by the organization but not yet paid by current, 30-90 days, over 90 days, and the total to date. Hovering over a bar displays a pop-up with the exact amount details.
- Aged Receivables: A chart displaying the amount currently owed or promised to the organization but not yet received by current, 30-90 days, over 90 days, and the total to date. Hovering over a bar displays a pop-up with the exact amount details.
KPIs
The system default KPIs on the dashboard display a snapshot of the organization's current financial status. Click anywhere within each of these boxes to drill down further into the features and to the specific GL code documents. The KPIs are displayed with their titles in the boxes as mentioned below:
- Year to Date Net Income: The organization's total net income for the organization. Year to Date Net Income refers to the period beginning the first day of the fiscal year up to the current date.
- Year to Date Cash Balance: The current total cash balance for the organization. Year to Date Cash Balance refers to the period beginning the first day of the fiscal year up to the current date.
- Outstanding Receivables: The total amount currently owed or promised to the organization but not yet received.
- Outstanding Payables: The total amount currently owed to creditors by the organization but not yet paid.