Trend Analysis | Net Income Year over Year
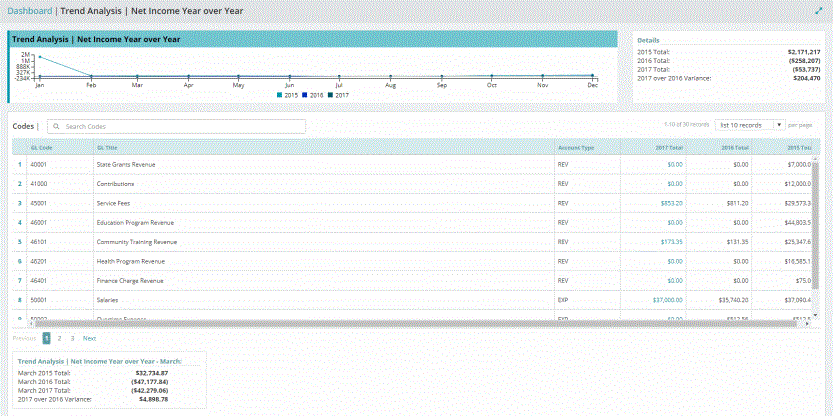
The Trend Analysis chart compares your organization's net income for the previous two fiscal years against the net income for the current fiscal year to date on a month-by-month basis. The net Income for a time period is defined as revenue - expense for that period.
You can drill down on a month of the line chart by clicking on the corresponding node. The vertical label (Y-axis) displays the actual dollar amounts. The horizontal label (X- axis) displays months. When you hover on a node (dot) along the line, the system displays the month, year, and actual dollar amount for all the three years.

This page displays four grids: Trend Analysis | Net Income Year over Year, Details, Codes, and Trend Analysis | Net Income Year over Year - <Month>.
Trend Analysis - Net Income Year over Year
Click on a year to toggle that year's display to create a combination of displays.
Previous Year: Displays the net income for the selected month for the previous fiscal year.
Current Year: Displays the net income for the selected month for the current fiscal year.
Next Year: Displays the projected net income for the selected month for the next fiscal year.
Details
Previous Year Total: Displays the total net income for the previous fiscal year.
Current Year Total: Displays the total net income for the current fiscal year.
Next Year Total: Displays the projected total net income for the next fiscal year.
Next Year over Current Year Variance: The projected difference between the next year and the current year.
Codes
To search for a GL Revenue or Expense account type, enter the GL code or title into the search box at the upper left of the table. All the transactions that match begin showing up in the list. To display the record, click on the blue link in the "Current Fiscal Year" column for that GL Code.
GL Account Code: The system displays the ID associated with Expense and Revenue account types.
GL Account Title: The title assigned to the GL code.
Account Type: The General Ledger type segment codes designation of EXP (Expense) or REV (Revenue).
Next Year Total: Displays the projected total amount (expense or revenue) in the next fiscal year for the GL code. Click the amount to display the Trend Analysis | Net Income Year over Year | GL Code chart.
Current Year Total: Displays the total amount (expense or revenue) in current fiscal year for the GL code.
Previous Year Total: Displays the total amount (expense or revenue) in fiscal previous year for the GL code.
Trend Analysis | Net Income Year over Year - <Month>
The system displays a snapshot for net income for the selected month, year over year, for the selected GL code:
Previous Year Total: Displays the total net income for the month of the previous fiscal year.
Current Year Total: Displays the total net income for the month of the current fiscal year.
Next Year Total: Displays the projected total net income for the month of the next fiscal year.
Next Year over Current Year Variance: The difference between the month of the next year and current year.