
Reading Click-Through Dashboard Reports
When you first access each dashboard you will notice that at least two to four reports are available for you to view by default. These are called the default dashboard reports for each section. You are able to specify if you want to keep those default reports and how they are viewed when you personalize your dashboard.
Dashboard reports support hovering. This means that if you hover your mouse over the report graphic, you will see that certain data becomes available to you.
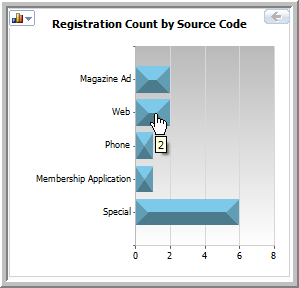
For example, by hovering the mouse over the Web bar in the Registration Count by Source Code report in the Events dashboard you are able to see immediately that two event registrations came from the Web. Notice also that a hand icon is available. This means that you can click-through on this report for more detailed information in the form of a new report and eventually to the List of people who actually registered.
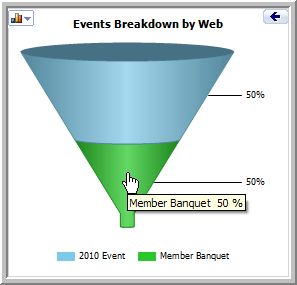
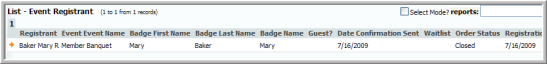
For example, clicking the Web bar on your first dashboard report prompts the second dashboard report which demonstrates that, of the 2 registrations received, 1 of them is for the Member Banquet registration. Notice again, that a hand appears when you hover over the Member Banquet source. This means that you can click-through once more to find the actual List of registrants for that registrant type.
|
Module |
Report |
Click-Through |
| CRM |
Customer Count by State |
Click-through to a breakdown of members and non-members by state. |
|
|
Active/Inactive Member Count by Member Type |
Click-through to active vs. inactive members report by Member Type specified. |
|
|
Customer Count Breakdown |
Click-through to a report that displays the breakdown by Member Type for member/prospects/non-members. |
|
|
|
|
| Administration / Membership |
Member Count & Revenue by Member Type |
A combination of bar and line report that shows the revenue and count of members by Member Type. The bar click-through to a list of the members for a particular Member Type. |
|
|
New Members by Join Year |
The report gives the count of the new members by year. It only lists data for the last 5 years. The report drills down into a breakdown of members by Member Type for that particular year. Further, you can drill down to the list of members. |
|
|
New Members by Member Type and Join Year |
This report provides the count of new members by member type for a particular Join year. |
|
|
|
|
| Event |
Top 3 Events Based on Event Revenue |
A bar chart displaying the top 3 events based on Event revenue. |
|
|
Bottom 3 Events Based on Event Revenue |
A bar chart displaying the bottom 3 events based on Event revenue. |
|
|
Registration Count Weeks Out |
Comparing the registration count for two events as of the number of weeks out prior to the event. The report provides you with three parameters: Event Title 1, Event Title 2, and the number of weeks. |
|
|
Registration Revenue Weeks Out |
Comparing the registration revenue for two events as of the number of weeks out prior to the event. The report provide you three parameters: Event Title 1, Event Title 2, and the number of weeks. |
|
|
Registrants by Source Code |
This report displays the registrant count by source code. It clicks-through to a funnel displaying the events that the registrant is registered for. It will drill through to a list of event registrants for the event with the appropriate source code. |
|
|
Breakdown by Source Code |
This report displays the events breakdown by source code indicating the percentage of the registrations with the particular source code. It clicks-through to a list of the event registrants. |
|
|
Registrations vs Cancellations |
A pie chart showing the percentage of all event registrations vs cancellations in the system. Clicks-through to a list of events for registration/cancellations. Further, it clicks- through to a list of event registrants. |
|
|
Registrations / Cancellations by Event |
This report shows the registration/cancellation count for Events. It clicks-through to a list of event registrants. |
|
|
Revenue Breakdown by Fee |
This reports shows the event revenue breakdown by fee. |
|
|
|
|
| Committee |
Most Prolific Members Across Committees |
This report lists the top 5 most active members across all committees. It clicks-through to a list of the committees that member is part of. |
|
|
Committees with Term endings |
This report is a stacked bar by committee with term endings by month. It clicks-through to a list of members for the particular committee whose term is ending. |