
Creating a Chart Report
Note: Be sure to have selected Chart for the report type as described in Creating a Dataset.
There are two types of charts available:
- Column Chart
- Pie Chart
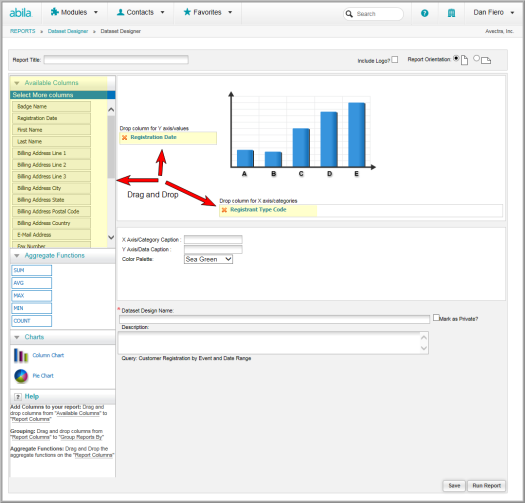
To create a chart report:
- Select (drag and drop) the columns needed in the chart report from the Available Columns bar into the X axis and Y axis of the chart.
- Arrange the columns into the desired order by dragging and dropping into place or click the red x to remove them and start over.
- Selecting More Columns
- Editing a Column
- Adding Aggregate Functions
- Using Chart Report Type Options
- Additional Dataset Formatting Options
- Click Save to save the dataset as described in Saving the Dataset.
The column choices displayed in Available Columns are the columns available in the selected query.
For more information about working with column data, see:
Or click Run Report to run the query report as described in Running the Dataset Report.